Unveiling Galaxy Bulge Formation with Gemini/GMOS
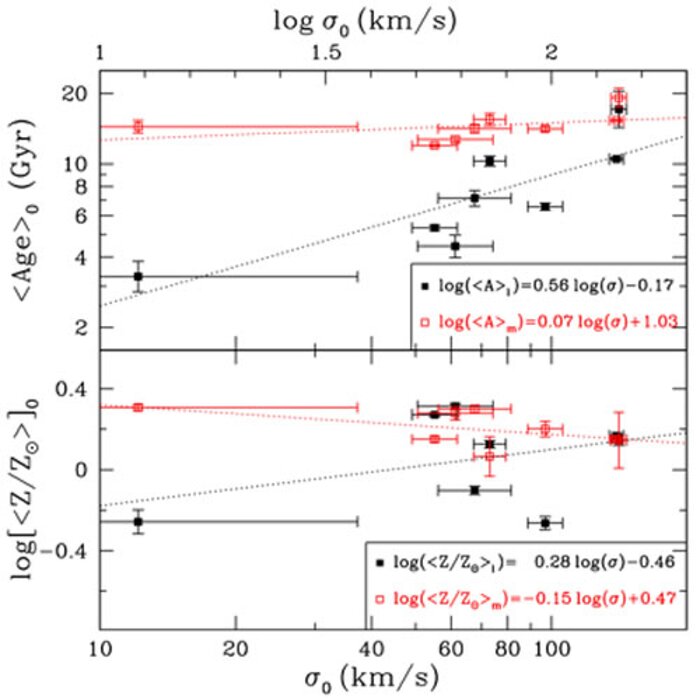
Average age (top) and Z (bottom) from the full population synthesis fits as a function of σ0. Black Solid Squares: light-weighted values. Red Open Squares: mass-weighted values. The black and red dotted lines are simple linear regressions to the light- and mass-weighted data respectively.
Credit:International Gemini Observatory/NOIRLab/NSF/AURA
About the Image
| Id: | geminiann09004d |
| Type: | Chart |
| Release date: | Feb. 11, 2009, 9:22 p.m. |
| Related announcements: | geminiann09004 |
| Size: | 500 x 500 px |
About the Object
| Category: | Illustrations |
