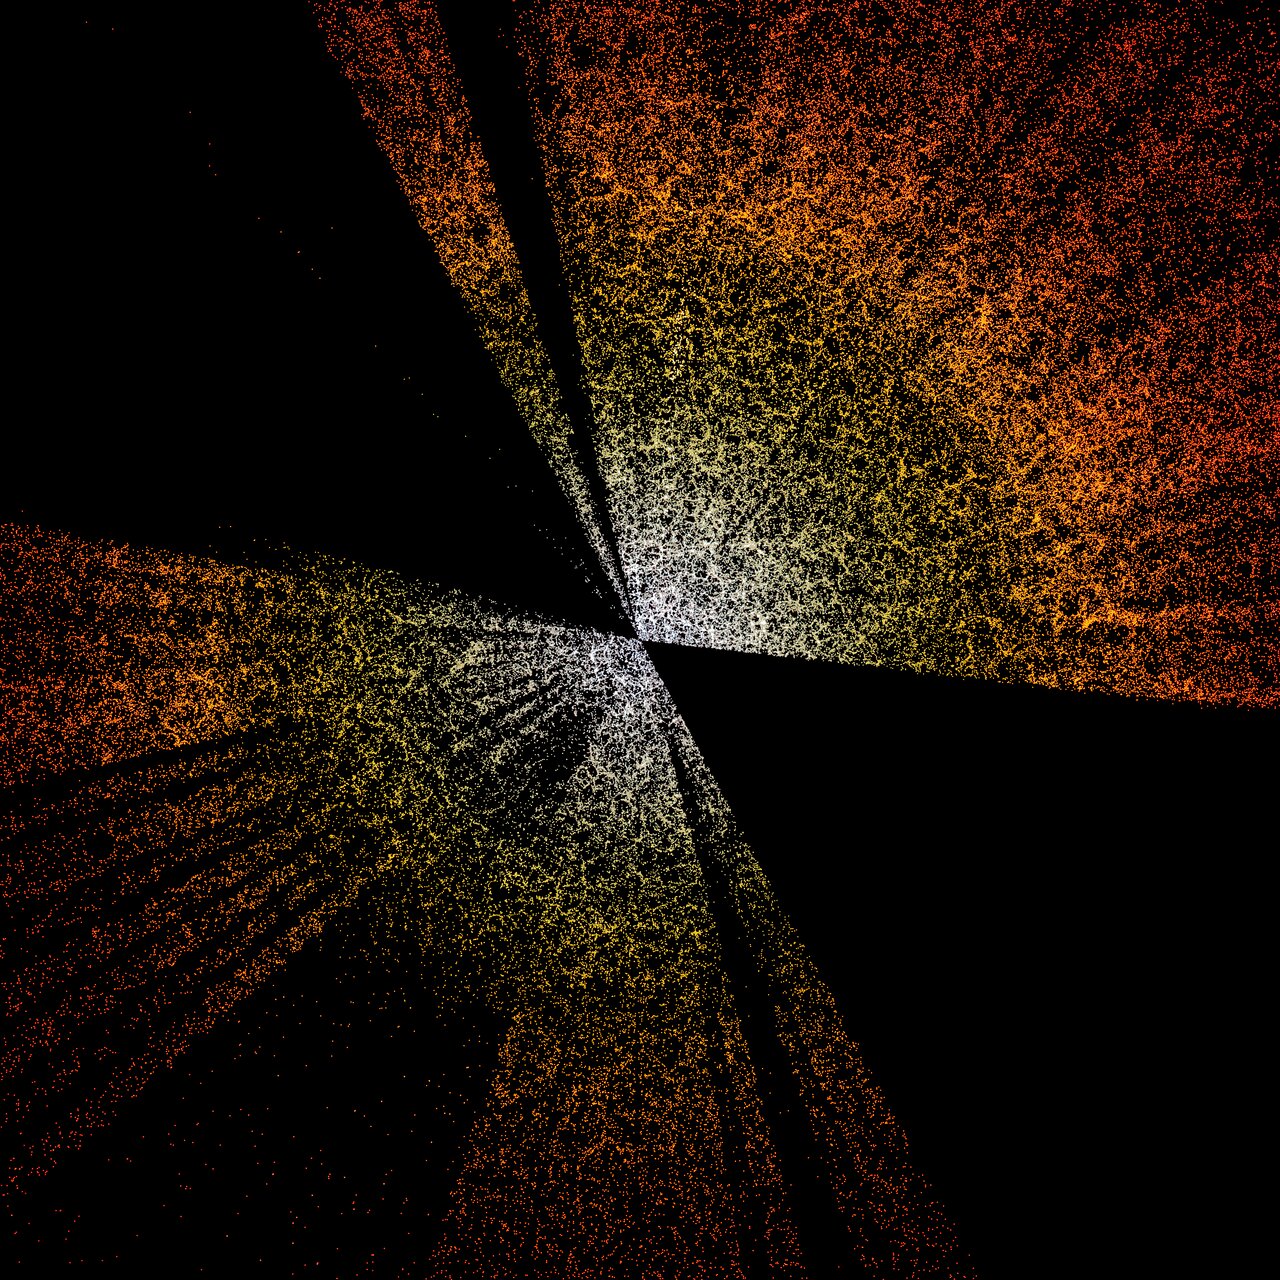
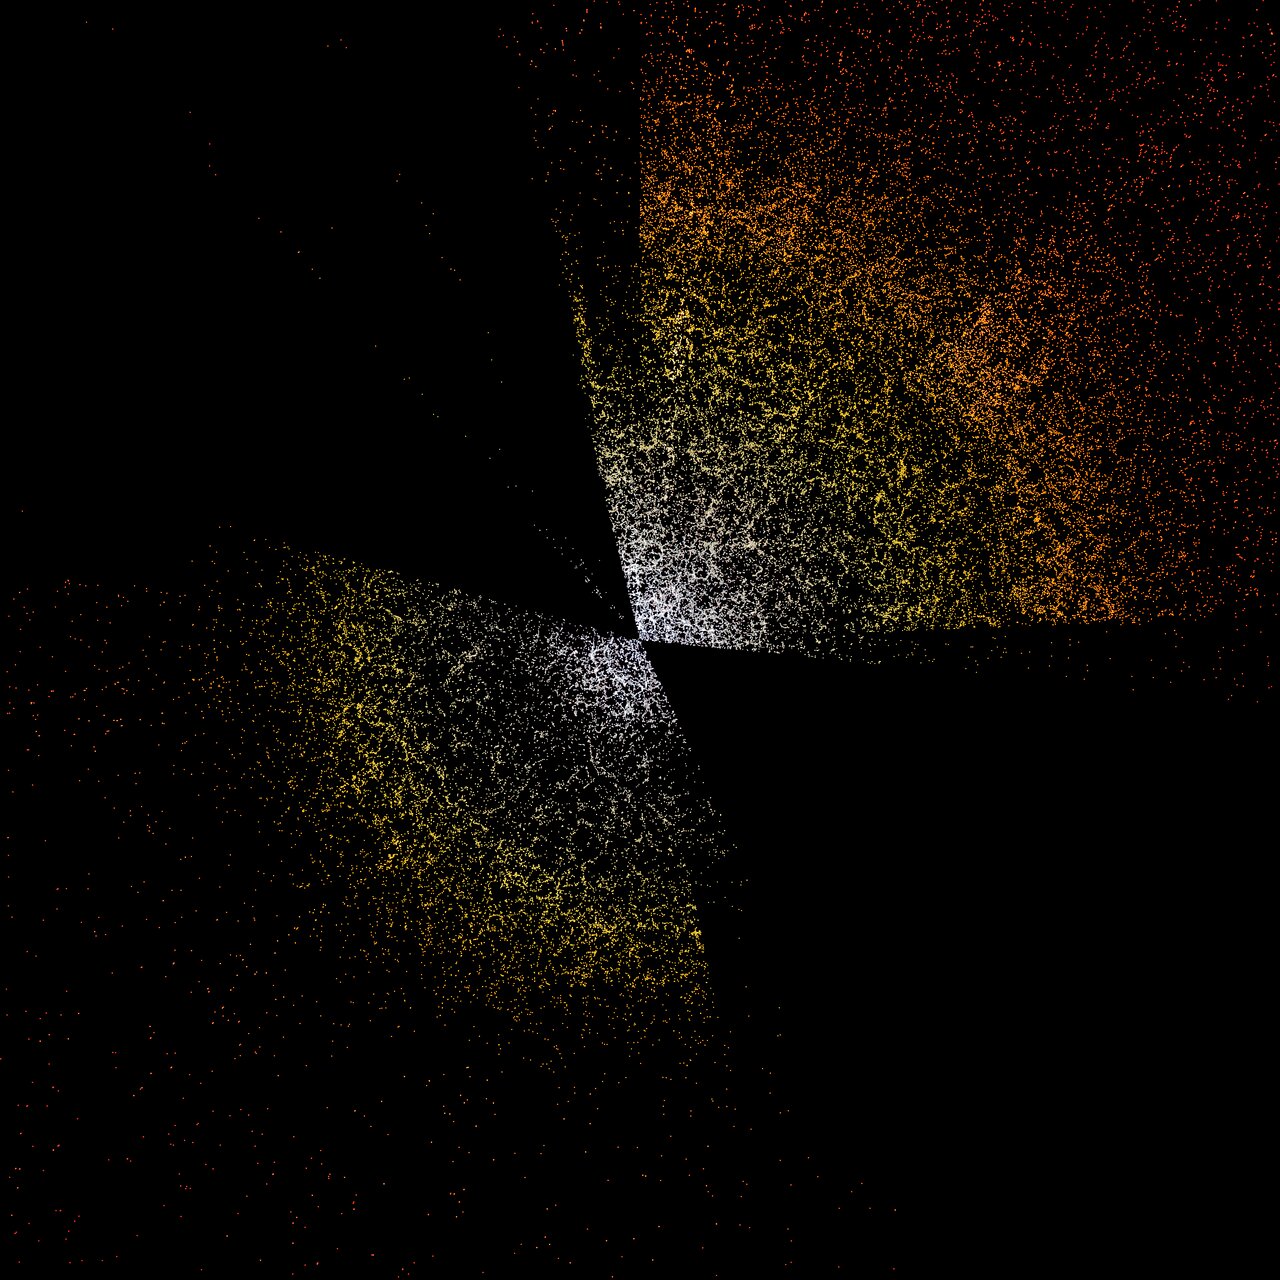
Comparison of complete Sloan Digital Sky Survey and first DESI data


Drag green handle to reveal images
A slice through the 3D map of galaxies from the completed Sloan Digital Sky Survey (right) and from the first few months of the Dark Energy Spectroscopic Instrument (DESI; left). Earth is at the center, with the furthest galaxies plotted at distances of 10 billion light-years. Each point represents one galaxy. This version of the DESI map shows a subset of 400,000 of the 35 million galaxies that will be in the final map.
Credit
D. Schlegel/Berkeley Lab using data from DESI
Acknowledgment: M. Zamani (NSF's NOIRLab)
About the Image Comparison
| Id: | noirlab2203a |
| Release date: | Jan. 13, 2022, 9 a.m. |
| Related releases: | noirlab2203 |

