¡Lo sentimos! Esta página aún no está disponible en su idioma preferido, por lo que estamos mostrando la versión original.
Galaxies Under the Cosmic Microscope
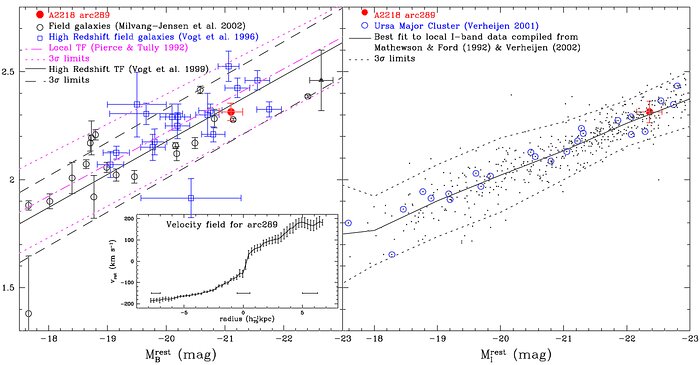
The red dot on the left panel plot shows Arc #289 on the rest frame B-Band Tully-Fisher relation, compared to high redshift (z = 0.83) field galaxies and other data sets. The inset shows the rotation curve derived from the [OII]3727 line GMOS-IFU observations; horizontal error bars are ~0.7 arcsec, seeing transformed to source frame. The right is the I-band Tully-Fisher relation (with Arc #289 as the red dot) from the references indicated in the panel.
Créditos:International Gemini Observatory/NOIRLab/NSF/AURA
About the Image
| Id: | geminiann03016f |
| Tipo: | Chart |
| Release date: | 2 de Septiembre de 2003 a las 05:00 |
| Related announcements: | geminiann03016 |
| Size: | 1591 x 829 px |
Sobre el Objeto
| Categoría: | Illustrations |
