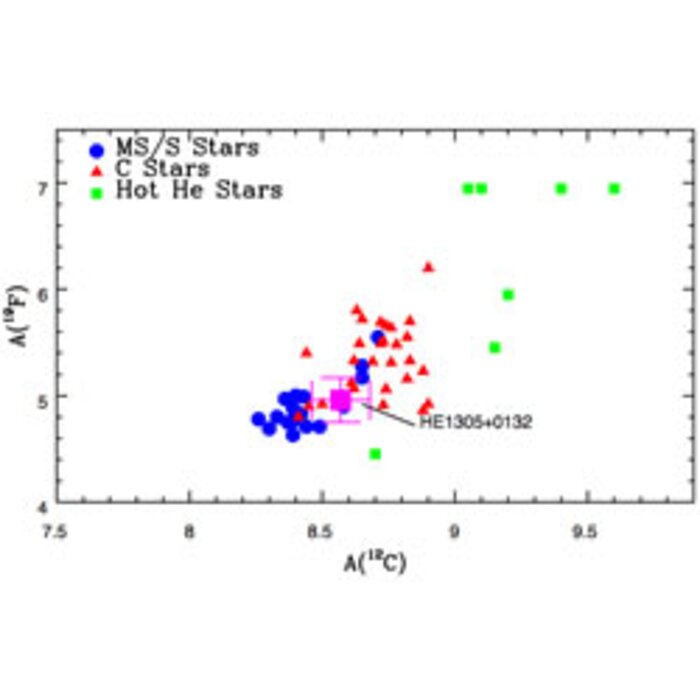
Plot of 19F vs. 12C abundances
Plot of 19F vs. 12C abundances, with HE 1305+0132 marked by the magenta square with error bars.
Credit:International Gemini Observatory/NOIRLab/NSF/AURA
About the Image
| Id: | geminiann08001c |
| Type: | Chart |
| Release date: | Jan. 8, 2008, 2:16 p.m. |
| Related announcements: | geminiann08001 |
| Size: | 250 x 250 px |
About the Object
| Category: | Illustrations |
