Redshifts of Quasi-Stellar Objects

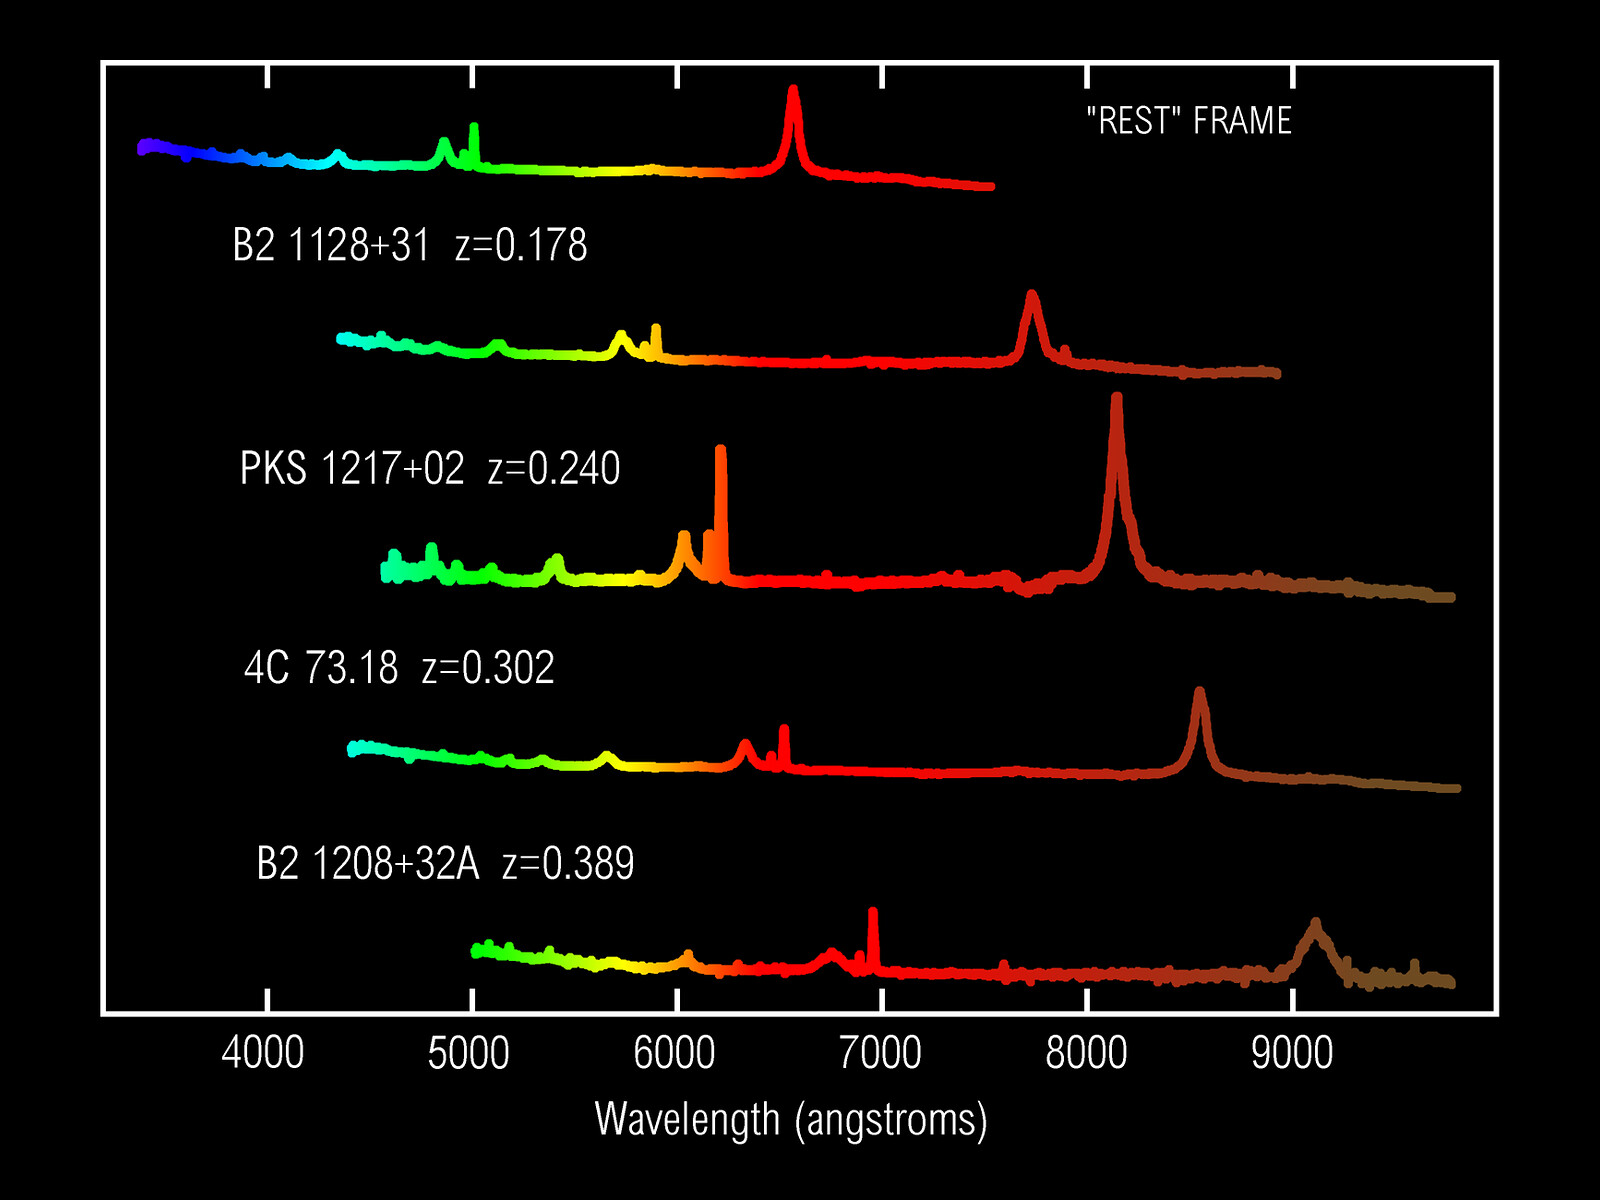
This image shows the spectra of four quasi-stellar objects (QSOs), along with an example of what the spectrum might look like for a typical QSO if it were not moving away from us. The upper spectrum, designated "Rest" Frame, shows the spectrum of a QSO moving at zero velocity with respect to the Earth. Four additional QSO spectra with increasing "redshift", or recession velocity, are shown as they appear to observers on Earth. The spectral lines are shifted more and more toward the red as the redshift increases. Astronomers use the shift of spectral lines to measure the velocity of astronomical objects moving toward or away from the Earth. The redshift of an object is simply the amount the wavelength of a spectral line is shifted, divided by the wavelength of the feature in its rest frame. In the rest frame spectrum, broad emission lines due to excited hydrogen atoms can be seen at wavelengths of 4340 (blue), 4860 (green), and 6562 (red) Angstroms. As redshift increases, the green line is shifted into the yellow spectral region, and then into the red region. The other hydrogen lines also shift, but the relative spacing (the ratio of the wavelengths of the lines) remains constant. The shift of the spectral lines is due to the velocity at which each QSO is moving away from the Earth. The spectral lines in QSOs receding more quickly are shifted more to the red. In an object moving toward the Earth, the spectral lines would be shifted toward the blue. B2 1208+32A, the fastest moving QSO shown, has a redshift of 0.389, and is moving away from the Earth at about 100,000 km/sec. The velocity (v, in km/sec) of an object can be calculated from its redshift (z) using the following equation, where c=300000 km/sec is the speed of light): (1 + z)^2 - 1 v = c ------------- (1 + z)^2 + 1 The redshift z can be calculated from the shift of the spectral lines as follows: z = (w_obs/w_rest) - 1 where w_obs is the wavelength of a spectral line measured from the spectrum, and w_rest is the laboratory wavelength. The units can be nanometers or Angstroms. The spectra were kindly provided by Michael Corbin from observations made at the Kitt Peak National Observatory's 2.1-meter telescope with the GoldCam Spectrograph.
Credit:C. Pilachowski, M. Corbin/NOIRLab/NSF/AURA/
About the Image
| Id: | noao-02053 |
| Type: | Chart |
| Release date: | June 30, 2020, 9:53 p.m. |
| Size: | 2000 x 1300 px |
About the Object
| Category: | Stars |